The first of two articles on the use of economic evaluations to guide the use of expensive treatment.
Introduction
Again, because the medicines involved are so expensive, value for money is essential. Cost-efficacy studies are undertaken to compare the costs and outcomes of a medicine with those of a relevant comparator. These economic evaluations help guide the introduction of safe and cost-effective medicines while containing healthcare expenditure [3]. They are used by academic researchers, pharmaceutical companies that set up biosimilars research and development programs and policy makers who make decisions about reimbursement of biosimilars. Such techniques are usually applied to medicines, but are relevant to any health technology.
Evidence from economic evaluations informs pharmaceutical reimbursement decisions in many countries. The requirement for economic evaluation fits within an overall trend toward evidence-based decision-making in health care [4].
Methods used and comparisons made
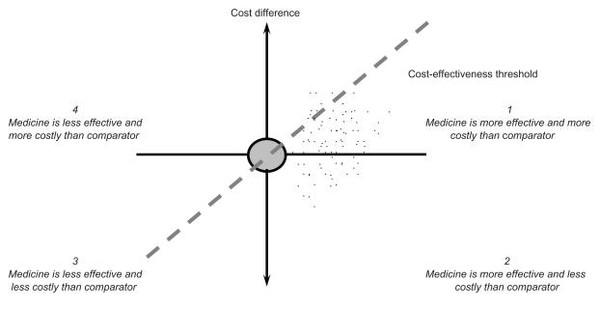
Detailed studies do not give simple ‘yes–no’ answers to questions such as ‘how does medicine B differ in price and efficacy from medicine A?’ However, the cost-effectiveness plane, see Figure 1, can be used to place medicines to be compared in different places, depending on the outcome of the evaluation undertaken [1].
The incremental cost-effectiveness ratios and how it is used
The incremental cost-effectiveness ratio is defined as the ratio of the change in cost of a therapeutic intervention, e.g. the new compared to the comparison treatment, to the change in effect of this intervention [5]. Incremental refers to the effect of switching interventions.
Often, the change in effects is measured in terms of the number of quality-adjusted life years (QALYs) gained by the intervention. This includes both health differences during the time alive and years won/lost due to a different time of death.
Example: If a fictional treatment costs a total of Euros 45,000 at today’s value and increases a person’s quality of life from 0.5 to 0.6 for the remainder of their life from age 70 years and onwards, and their expected lifespan increases from 73 to 75, the total gain in QALYs is 0.1*3 + 0.6*2 = 1.5. The incremental cost-effectiveness ratios will then be Euros 45,000/1.5 = Euros 30,000.
Figure 1: The cost-effectiveness plane [1]
The horizontal axis portrays the difference in effectiveness, e.g. life years, between a medicine and its comparator. The more effective a medicine, the further to the right it lies. The vertical axis represents not the price but the cost difference between a medicine and its comparator. The results of an economic evaluation can be expressed in the form of a cost-effectiveness ratio. This ratio relates the difference in costs between a medicine and the comparator to the difference in outcomes. The incremental cost-effectiveness ratios can be represented as a point on the cost-effectiveness plane [3]. A medicine may cost more or less and be more or less effective than its comparator, so it may fall into one of the four quadrants.
The cost-effectiveness plane, see Figure 1, also reflects the maximum cost per unit of outcome that a healthcare payer is willing to pay for a medicine. A medicine with an incremental cost-effectiveness ratios below the threshold value is likely to be accepted by a healthcare payer and a medicine with an incremental cost-effectiveness ratios exceeding the threshold value is likely to be refused. The gradient of the dashed line in Figure 1 represents a specific threshold incremental cost-effectiveness ratio. A medicine is cost-effective if its point estimate falls to the southeast of this dashed line.
Table 1 provides an overview of threshold incremental cost-effectiveness ratios in selected countries. The table shows how selected countries assess cost-effectiveness. A medicine can be assessed in several ways, and different standards can be applied depending on the difference it makes, how much it costs and the general cost of living in the country. Note that these numbers will change as the value of a country’s currency fluctuates. These threshold ratios set the dotted line on Figure 1 for each country.
Table 1: Threshold incremental cost-effectiveness ratios in selected countries [1]
| Country (currency)
|
Threshold value in local currency
|
Threshold value in Euros
|
| Australia (AUS$)
|
42,000–76,000§
|
24,700–44,700§
|
| Canada (CAN$)
|
20,000–100,000*
|
12,700–63,300*
|
| England/Wales (GBP)
|
20,000–30,000*
|
22,800–34,100*
|
| The Netherlands (Euros)
|
20,000–80,000*
|
20,000–80,000*
|
| New Zealand (NZ$)
|
3000–15,000*
|
1400–7200*
|
| United States (US$)
|
50,000*
|
34,400*
|
| §: per life year. *per quality-adjusted life year. Local threshold values were converted into Euros using market exchange rates
|
Other evaluations
No reimbursement authorities have issued guidelines about which technique of economic evaluation is appropriate to calculate the cost-effectiveness of a biosimilar and since there may be uncertainty surrounding relative effectiveness, submissions to reimbursement authorities may include a cost-minimization analysis as well as a cost-effectiveness or cost-utility analysis [6].
Additionally, such exercises may carry out sensitivity analyses, exploring the impact of changes in relative effectiveness on the cost-effectiveness of a biosimilar.
Recently, innovative reimbursement mechanisms have been introduced by healthcare payers such as risk-sharing arrangements. A risk-sharing arrangement is a scheme in which the manufacturer shares the risk with the healthcare payer that the product may not be effective for a particular patient. If the product does not have the expected effect, the company may lose some or all product revenue or needs to provide a replacement product [7].
Such arrangements are instituted at the level of a defined patient population rather than a group of patients cared for by an individual institution or healthcare provider, may require physicians to be trained in the appropriate use of the product, and necessitate the implementation of a tracking system to follow up its use.
As risk-sharing arrangements are in place for selected biologicals in some European countries, they are likely to be rolled out to apply to biosimilars as well and affect their cost-effectiveness [8].
Due to potential concerns surrounding the long-term safety, i.e., risk of immunogenicity and rare adverse events, and effectiveness of a biosimilar, there is a need to consider the cost-effectiveness of a biosimilar after a number of years following the admission to the reimbursement system in addition to the assessment of its cost-effectiveness at the time of the reimbursement application. Therefore, manufacturers need to explore setting up databases or observational studies to demonstrate the post-launch cost-effectiveness of a biosimilar based on phase IV trials.
Conclusions
As a biosimilar is likely to be less expensive than the comparator (originator) biological, the assessment of the cost-effectiveness of a biosimilar depends on the relative effectiveness. If appropriately designed and powered clinical studies demonstrate equivalent effectiveness between a biosimilar and the comparator, then a cost-minimisation analysis needs to be carried out and the least expensive medicine chosen. If there are differences in the effectiveness of a biosimilar and the comparator, other techniques of economic evaluation need to be employed, such as cost-effectiveness analysis or cost-utility analysis. Given that there may be uncertainty surrounding the long-term safety and effectiveness of a biosimilar, the cost-effectiveness of a biosimilar needs to be calculated several times throughout the product’s life cycle.
Related articles
Relative effectiveness and cost minimisation for biosimilars
Economic evaluation of biosimilars
References
1. Simoens S. Biosimilar medicines and cost-effectiveness. Clinicoecon Outcomes Res 2011;3:29-36.
2. European Generic medicines Association. Vision 2015. The EGA’s thoughts on how to improve the legal and regulatory framework for generic and biosimilar medicines. 2010. [cited 2011 November 24]. Available from: www.egagenerics.com/doc/EGA_Vision_2015.pdf
3. Drummond M, Sculpher MJ, Torrance GW, O’Brien BJ, Stoddart GL. Methods for the Economic Evaluation of Health Care Programmes. 3rd ed. Oxford, UK: Oxford University Press; 2005.
4. Perleth M, Jakubowski E, Busse R. What is ‘best practice’ in health care? State of the art and perspectives in improving the effectiveness and efficiency of the European health care systems. Health Policy. 2001;56(3):235-50.
5. GaBI Online - Generics and Biosimilars Initiative. What is the incremental cost-effectiveness ratio (ICER)? [www.gabionline.net]. Mol, Belgium: Pro Pharma Communications International [cited 2011 December 16]. Available from: www.gabionline.net/Generics/General/What-is-the-incremental-cost-effectiveness-ratio-ICER
6. Stewart A, Aubrey P, Belsey J. Addressing the health technology assessment of biosimilar pharmaceuticals. Curr Med Res Opin 2010;26(9):2119-26.
7. Cook JP, Vernon JA, Manning R. Pharmaceutical risk-sharing agreements. Pharmacoeconomics 2008;26(7):551–6.
8. Zaric GS, Xie B. The impact of two pharmaceutical risk-sharing agreements on pricing, promotion, and net health benefits. Value Health 2009;12(5):838-45.


 0
0









Post your comment