Data on biological sales for 2018 show that the US tops the list of Organisation for Economic Co-operation and Development (OECD) countries in terms of both per capita sales and share of sales. The data are provided by the Government of Canada in a May 2020 report and show that biologicals account for almost a third of total pharmaceutical sales in Canada.
Analysis of biological sales for OECD countries
Home/Reports
|
Posted 03/07/2020
 0
Post your comment

Information recently published by the Patented Medicine Prices Review Board (PMPRB) in Canada includes an analysis of biological medicine sales in 2018, including international comparisons.
The analysis included medicines in Schedule D of Health Canada’s Drug Product Database [1], or medicines considered a prescription biological within this database. All insulin biologicals were included, regardless of whether they require a prescription or not. Biologicals containing the same medicinal ingredients but sold elsewhere in the world were also included.
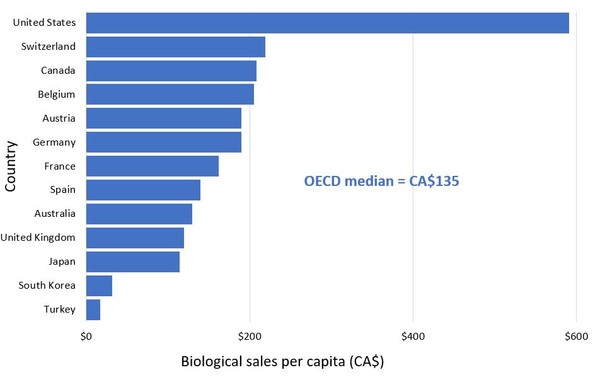
The report shows the per capita sales of biological medicines for OECD countries in 2018, a selection of which is shown in Figure 1.
Figure 1: Per capita sales of biological medicines, OECD, 2018
Source: IQVIA MIDAS Database, prescription retail and hospital markets, 2018
These data reveal that people in Canada spent an average of CA$208 per person on biologicals in 2018, which is CA$73 above the OECD median. This means Canada spends more on biologicals per capita than almost all other industrialized countries. The US is even further above this level, with an average per capita spending of CA$591.
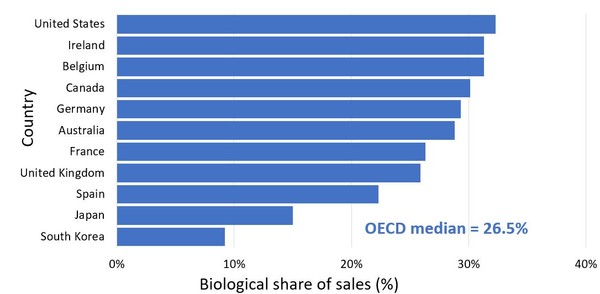
In terms of the share of total pharmaceutical sales represented by biological drugs, the US again tops the chart at 32.3%, followed by Ireland and Belgium, both at 31.3%, see Figure 2. Canada has a share of just over 30%.
Figure 2: Biological medicine share of total pharmaceutical sales, OECD, 2018
Source: IQVIA MIDAS Database, prescription retail and hospital markets, 2018
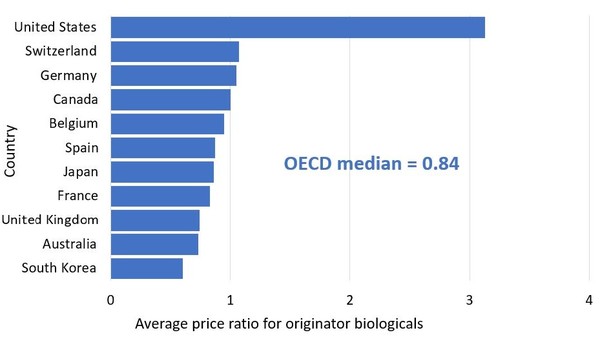
Further analysis of average pricing shows that prices for originator biologicals are again highest in the US, followed by Switzerland, Germany and Canada, see Figure 3.
Figure 3: Average bilateral foreign-to-Canadian price ratios for originator biologicals, OECD, 2018
Source: IQVIA MIDAS Database, prescription retail and hospital markets, 2018
The average price of originator biologicals in Canada was the fourth highest of OECD member countries in 2018. The international median price was 16% lower than the Canadian level.
Related article
Biosimilar infliximab uptake in Canada
Low levels of biosimilar uptake in Canada
The cost of biologicals in Canada
Trends in biological drugs in Canada
Reference
1. Health Canada. Drug Product Database online query [homepage on the Internet]. [cited 2020 Jul 3]. Available from: https://health-products.canada.ca/dpd-bdpp/index-eng.jsp
Permission granted to reproduce for personal and non-commercial use only. All other reproduction, copy or reprinting of all or part of any ‘Content’ found on this website is strictly prohibited without the prior consent of the publisher. Contact the publisher to obtain permission before redistributing.
Copyright – Unless otherwise stated all contents of this website are © 2020 Pro Pharma Communications International. All Rights Reserved.
| Biosimilar infliximab uptake in Canada |
Source: Government of Canada
Guidelines
US guidance to remove biosimilar comparative efficacy studies
New guidance for biologicals in Pakistan and Hong Kong’s independent drug regulatory authority
Policies & Legislation
WHO to remove animal tests and establish 17 reference standards for biologicals
EU steps closer to the ‘tailored approach’ for biosimilars development

Home/Reports Posted 21/11/2025
Advancing biologicals regulation in Argentina: from registration to global harmonization

Home/Reports Posted 10/10/2025
The best selling biotechnology drugs of 2008: the next biosimilars targets




Post your comment