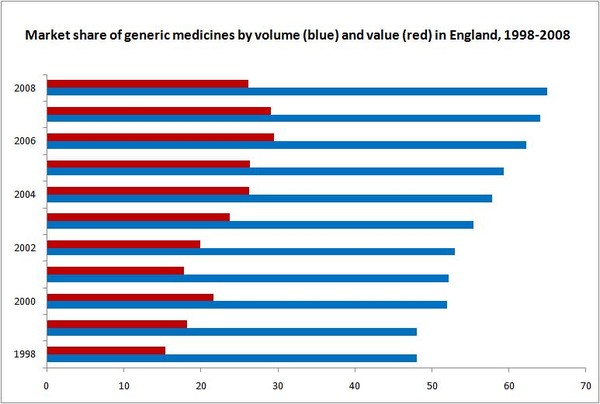
The market share of generic medicines in the UK has more than doubled over the last decade. Public expenditure on generic medicines rose from Euros 655 million in 1994 (market share by value of 8.6%) to Euros 3,625 million in 2004 (market share by value of 20.1%) [1], but dropped to approximately GBP 2,500 million (Euros 2,992 million) in 2005 (market share by value of 29.5%) [2].
The market share of generic medicines by volume (prescriptions) has also followed an upward trend, and reached 65% in 2008 [3].
Sources:2000-2008 [3-8].
Data on generic medicines market share by volume and value are reported for England and not for the whole of the UK, however, the trends are similar for the rest of the UK (Northern Ireland, Scotland, and Wales).
The UK has in principle a free pricing system. However, the price of medicines reimbursable by the NHS is subject to the Pharmaceutical Price Regulation Scheme (PPRS). This scheme, however, only covers brand named products and therefore excludes generic medicines [9].
In the UK, market prices are set by competition with no barriers to entry other than gaining the product’s marketing authorisation based on its safety, quality and efficacy. This leads to a vibrant multi-source market in generics, minimising the scope for shortages and delivering on average the lowest market prices in Europe – and beyond.
Unlike most of the rest of Europe, the vast majority of generic medicines in the UK are marketed by the generic name or international non-proprietary name (INN). Physicians are trained at medical school to write prescriptions by INN, except where there is a clinical reason for doing otherwise. Primary Care Trusts also encourage physicians to prescribe generically in order to benefit from the savings due to the lower costs of generics.
Generic prescribing has increased significantly in England and has almost doubled since 1995 when around 40% of prescriptions were written generically to 82% in 2008 [2-3].
The number of prescription drugs dispensed generically in England has also increased significantly from 48% in 1989 to 65% in 2008 [3]. The remaining 17% (i.e. of those prescriptions written generically) in 2008 were drugs still under patent protection.
Highlights of the generics market in the UK
- Market share of generic medicines by prescription is more than 62%, but only 29.5% in value.
- Free pricing, but regulated and sometimes controlled by the government.
- Generics companies compete with each other on price, driving down prices, and enabling the NHS to capture the cost-saving potential of generics.
- Medical students are taught to prescribe by INN and INN prescribing by physicians is common practice (> 82% in 2008) [3].
- Generics prescribing has been stimulated by setting physician budgets in combination with generics prescribing targets, incentive schemes, and prescribing guidelines.
- The UK MHRA has stated that biologics should be prescribed by brand name to ensure that automatic substitution of a biosimilar does not occur when the medicine is dispensed by the pharmacist.
- In 2008, an estimated GBP 400 million was saved through more cost-effective prescribing practices [10].
References
1. Simoens S, De Coster S. Sustaining Generic Medicines Markets in Europe. April 2006. [monograph on the Internet]. Brussels, Belgium, European Generic Medicines Association (EGA) [cited 2011 May 13]. Available from: www.egagenerics.com/doc/simoens-report_2006-04.pdf
2. Office of Fair Trading (OFT). The Pharmaceutical Price Regulation Scheme: An OFT market study. February 2007.
3. NHS National Statistics. The NHS Information Centre (Health Care).Prescriptions Dispensed in the Community Statistics for 1998 to 2008: England. 29 July 2009.
4. NHS National Statistics. The NHS Information Centre (Health Care).Prescriptions Dispensed in the Community Statistics for 1989 to 1999: England. Statistical Bulletin 2000/20. August 2000.
5. NHS National Statistics. The NHS Information Centre (Health Care).Prescriptions Dispensed in the Community Statistics for 1990 to 2000: England. Statistical Bulletin 2001/19. 9 August 2001.
6. NHS National Statistics. The NHS Information Centre (Health Care).Prescriptions Dispensed in the Community Statistics for 1992 to 2002: England. Bulletin 2005/02/HSCIC31. July 2003.
7. NHS National Statistics. The NHS Information Centre (Health Care).Prescriptions Dispensed in the Community Statistics for 1994 to 2004: England. Bulletin 2005/02/HSCIC. July 2005.
8. NHS National Statistics. The NHS Information Centre (Health Care).Prescriptions Dispensed in the Community Statistics for 1996 to 2006: England. Bulletin: IC 2007 11. 11 July 2007.
9. Tilson L, Barry M. European Pharmaceutical Pricing and Reimbursement Strategies. National Centre for Pharmacoeconomics, Dublin 2005.
10. Department for Business Innovation & Skills (BIS). Final Government response to recommendations aimed at Government contained in the OFT report ‘The Pharmaceutical Price Regulation Scheme’. June 2009.


